Benchmarks
The benchmark notebooks under
benchmarks/
each follow a tight setup → sweep → table → plot shape and run in
~5 minutes on a laptop. Numbers below come from
01_size_scaling.ipynb on a typical SSD-backed workstation; treat
them as order-of-magnitude references — wall times depend on disk,
filesystem, and OS cache state.
Notebook |
Axis swept |
Fixed |
|---|---|---|
|
vertex count |
point cloud, local backend |
|
geometry type (all seven) |
|
|
storage backend ( |
point cloud, |
Vertex scaling — 01_size_scaling
A point cloud with N random vertices in [0, 1000)³ is written and
read four ways against a pandas / CSV baseline. Each N is averaged
over 10 runs; bands are 95% Student’s-t confidence intervals (df=9).
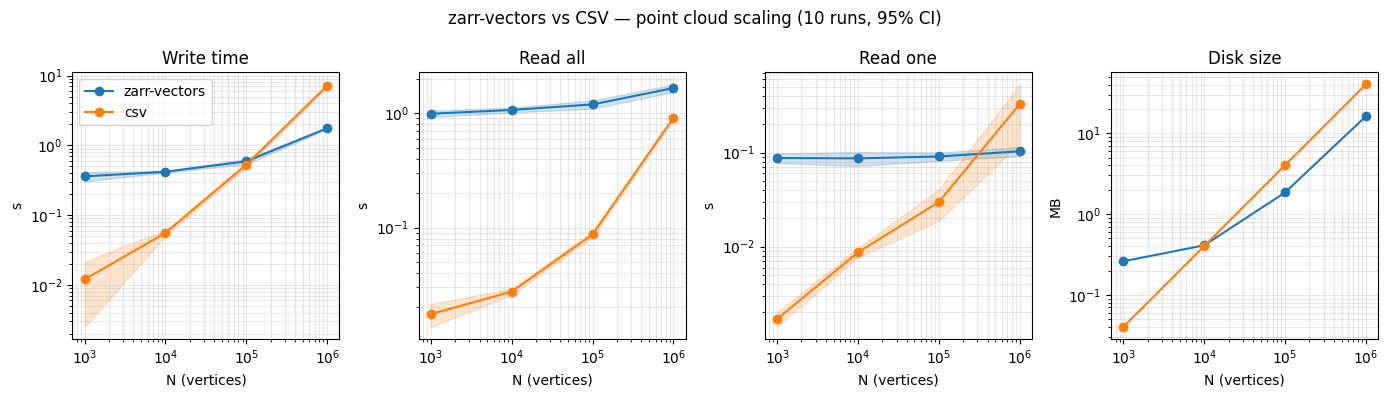
zarr-vectors pays a fixed ~0.4 s setup cost (zarr metadata,
fragment-index sidecars, one array per spatial chunk) regardless of
N, then scales sublinearly. CSV scales linearly from the first
point — to_csv formats and writes every row sequentially, read_csv
scans the byte stream once, and a “random row” read is read_csv(..., skiprows=range(1, row_idx + 1), nrows=1) which still parses every
preceding line before the one it wants. Crossover points:
Operation |
CSV wins when… |
zarr-vectors wins when… |
|---|---|---|
Write |
|
|
Read all |
|
|
Read one |
|
|
Disk size |
|
|
Dtype and on-disk encoding
Both sides start from the same float32 input
(numpy.random.default_rng().uniform(...).astype(np.float32)).
Stage |
zarr-vectors |
pandas / CSV |
|---|---|---|
On-disk encoding |
packed |
decimal text, one row per line |
Bytes per |
12 (pre-compression) |
~30–50 (8–12 chars per float + delimiters) |
Read result dtype |
|
|
Two dtype asymmetries drive the plot. CSV renders each float as a
decimal string ({:.12g} by default), so a 16-byte (x, y, z, intensity) row blows up to ~40 bytes of text — and text does not
compress with the density Blosc-BitShuffle gives binary float32. On
read, pandas silently widens every column to float64 unless
dtype= is set; zarr-vectors round-trips the exact float32 it
stored.
The constant ~0.1 s “Read one” floor for zarr-vectors at every N is
the lazy reader (zarr_vectors.lazy.open_zv) opening the store,
listing chunks once, and decoding a single Blosc-compressed
vertices/<i.j.k> chunk — no scan, no offset table to walk.
Running locally
pip install zarr-vectors pandas matplotlib
jupyter lab benchmarks/
Expected runtime on a laptop:
01_size_scaling: a few minutes (the 1 M-vertex case dominates).02_data_types: ~30 seconds.03_backends: ~10 seconds without cloud, longer with.
Cloud-backend mode
Notebook 03_backends.ipynb benchmarks the obstore and fsspec
cloud backends only when the ZV_BENCH_S3_URL env var is set:
export ZV_BENCH_S3_URL="s3://my-bucket/zv-bench/"
pip install "zarr-vectors[obstore]"   # preferred
# or
pip install "zarr-vectors[cloud]"     # fsspec fallback
Without the env var the cloud rows are skipped and a one-row local-only result is reported.
Caveats
These notebooks measure disk bytes and wall time only — no memory profiling.
No CI gating and no
pytest-benchmarkintegration: regressions are not caught automatically.Different geometry types do genuinely different work; do not cross-compare rows of
02_data_types.Numbers are not directly comparable across hardware, file systems, or cloud regions.
The CSV baseline uses pandas’ default
read_csvbehaviour (float64 output, no chunked reads). A tuned baseline withdtype=np.float32andengine='c'would narrow the read gap somewhat but not change the random-access scaling.
To regenerate the notebooks from the source recipe:
python benchmarks/_build.py